

RD variables
Relative demand, which is the firm demand divided by the industry average demand, will be predicted based on the following variables:
 |
 |
|
 |
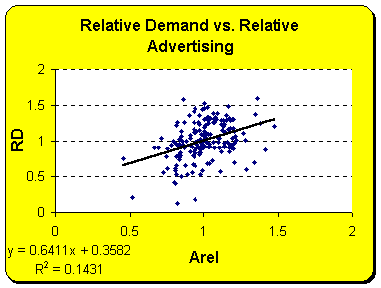
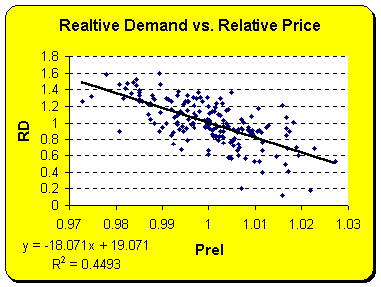
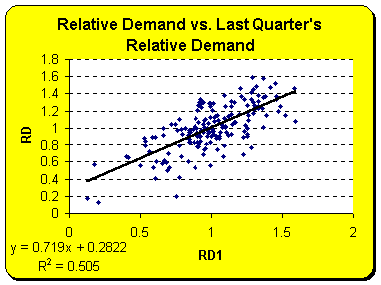
The scatter plots show that
two independent variables do correlate to the dependent variable, which is
relative demand. Relative advertising, however, does not correlate to
relative demand very much.
|
|
A correlation matrix is needed to get a better understanding of the relationship between all of the variables.
| RD | Prel | Arel | RD1 | |
| RD | 1.000 | |||
| Prel | -0.495 | 1.000 | ||
| Arel | 0.382 | 0.417 | 1.000 | |
| RD1 | 0.833 | -0.248 | 0.170 | 1.000 |
The correlation matrix confirms, that Arel is not very much correlated to RD, in fact it is more correlated to Prel. It can also bee seen, that the independent variables are not highly correlated to each other.
A regression analysis reveals how well RD can be predicted using the independent variables:
| Regression Analysis for RD, Using Prel, Arel, and RD1 as Independent Variables | ||||||
| Regression Statistics | It turns out from the regression analysis, that all independent variables are indeed independent, and the coefficients are able to explain roughly 95% of the values of Relative Demand | |||||
| Multiple R | 0.9785 | |||||
| R Square | 0.9575 | |||||
| Adj. R Squ. | 0.9568 | |||||
| Observations | 179 | |||||
| Regression Coefficients | ||||||
| Coefficients | Stand. Err. | t Stat | P-value | |||
| Intercept | 16.1300 | 0.4445 | 36.2862 | 0.0000 | ||
| Prel | -16.4445 | 0.4441 | -37.0255 | 0.0000 | ||
| Arel | 0.7796 | 0.0269 | 28.9347 | 0.0000 | ||
| RD1 | 0.5334 | 0.0164 | 32.4615 | 0.0000 | ||
Based on the table above, the following equation can be created:
RD=16.1300-16.4445*Prel+0.7796*Arel+0.5334*RD1
This equation explains roughly 95% of all RD values based on Prel, Arel and RD1.